
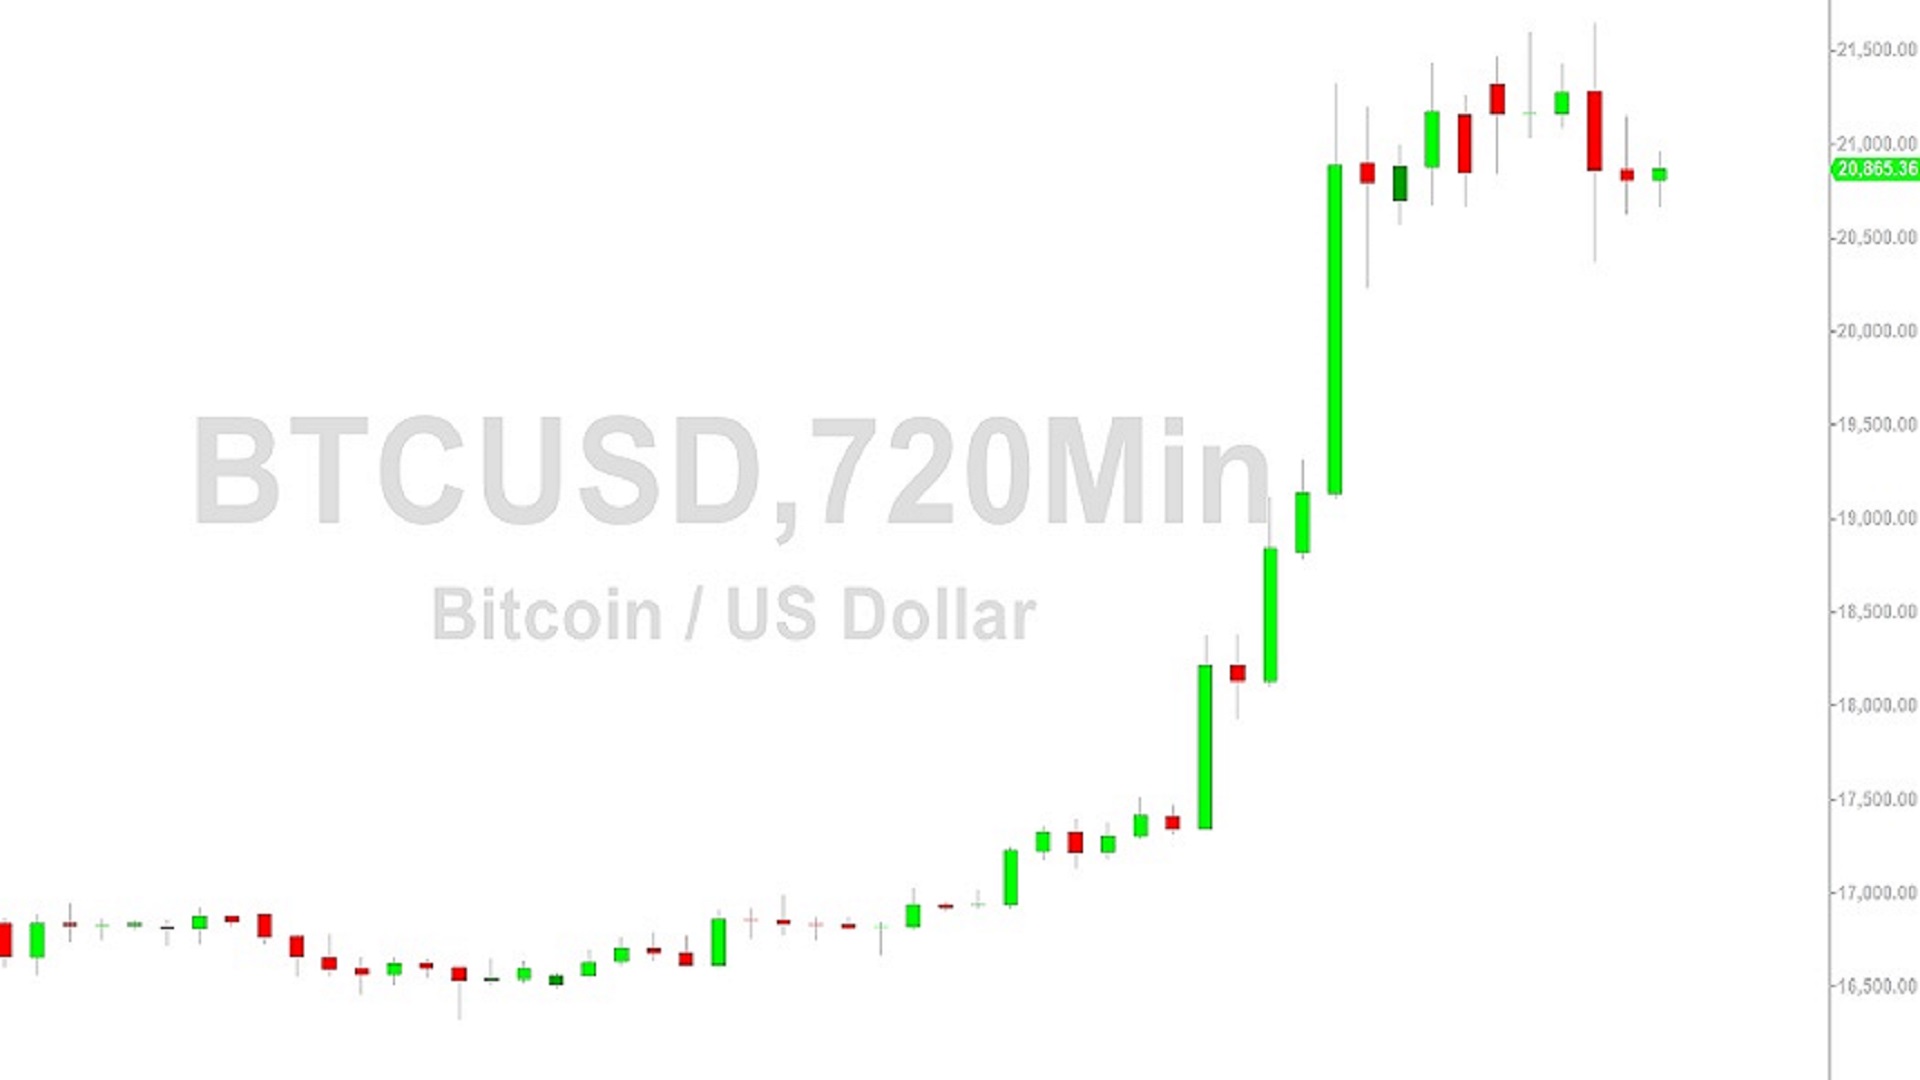
BTC/USD Tests 20947 Again: Sally Ho’s Technical Analysis – 20 January 2023
Bitcoin (BTC/USD) worked to reclaim recent losses early in the Asian session as the pair moved from the 20370.01 area to the 20960 area, a test of an upside price objective around the 20947.28 area that is related to buying pressure around the 16326 and 17325 levels. Notably, BTC/USD’s low around the 20370.01 area during the pullback was a test of the 23.6% retracement of the recent appreciating range from 16326.16 to 21650.21. BTC/USD recently absorbed the 21465.62 area before giving back some gains, representing a test of the 61.8% retracement of the depreciating range from 25214.57 to 15460. Major Stops were recently elected above the 19856.70 and 20947.28 areas en route to the ongoing relative highs, upside price objectives related to buying pressure that emerged around the 16326.16 and 17315.08 areas. Stops were also triggered above the 20190.78 area during the appreciation, representing the 78.6% retracement of the depreciating range from 21478.80 to 15460, and this level recently served as technical support during a pullback.
BTC/USD bulls are eyeing the 21920, 23127.09, and 23196.08 levels as areas of potential technical resistance and selling pressure, related to historical selling pressure that emerged around the 25214.57, 32371, and 48240 levels. Stops were also recently elected above the 19260.93 area, an important upside price objective related to buying pressure that emerged around the 15460 and 16273.40 levels. Following the recent move higher to multi-month highs, technical support levels and areas of potential buying pressure are around the 20026, 19153, 18448, 17743, 16870, and 16739 levels. Below current price activity, technically significant areas include the 15900, 15512, 15313, 14500, 14364, 13369, 10727, 10432, 9682, 8837, and 7538 levels. Traders are observing that the 50-bar MA (4-hourly) is bullishly indicating above the 100-bar MA (4-hourly) and above the 200-bar MA (4-hourly). Also, the 50-bar MA (hourly) is bullishly indicating above the 100-bar MA (hourly) and above the 200-bar MA (hourly).
Price activity is nearest the 50-bar MA (4-hourly) at 19931.37 and the 100-bar MA (Hourly) at 20019.99.
Technical Support is expected around 18390.99/ 16714.46/ 14500.15 with Stops expected below.
Technical Resistance is expected around 21870.79/ 22912.49/ 23127.09 with Stops expected above.
On 4-Hourly chart, SlowK is Bullishly above SlowD while MACD is Bearishly below MACDAverage.
On 60-minute chart, SlowK is Bullishly above SlowD while MACD is Bullishly above MACDAverage.
Disclaimer: Sally Ho’s Technical Analysis is provided by a third party, and for informational purposes only. It does not reflect the views of Crypto Daily, nor is it intended to be used as legal, tax, investment, or financial advice.