
BTC/USD in Volatile Action: Sally Ho’s Technical Analysis – 15 February 2023
Bitcoin (BTC/USD) awaited fresh technical sentiment early in the Asian session as the pair continued to react to a sharp depreciation to the 21545.67 area, a move that represented a test of the 61.8% depreciation of the appreciating range from 21366.45 to 21903.72. Traders recently lifted BTC/USD as high as the 22091.88 level, above another downside price objective around the 21962.63 area, before selling pressure resumed. Following selling pressure that strengthened around the 22832.44 area, downside price objectives include the 20982.96, 20209.06, 19251.53, and 17703.74 areas. Upside price objectives related to buying pressure around the 16326.16 area include the 25455, 25774, 27609, and 28004 levels.
Upside price objectives related to buying pressure around the 15460 area include the 26612, 26931, 29244, and 29639 levels. Following the recent move higher to multi-month highs, technical support levels and areas of potential buying pressure are around the 21230, 20294, 19861, 19357, and 18822 levels. Stops are cited below the 18199, 18024, 17537, and 17343 levels. Below current price activity, technically significant areas include the 15900, 15512, 15313, 14500, 14364, 13369, 10727, 10432, 9682, 8837, and 7538 levels. Traders are observing that the 50-bar MA (4-hourly) is bearishly indicating below the 100-bar MA (4-hourly) and above the 200-bar MA (4-hourly). Also, the 50-bar MA (hourly) is bearishly indicating below the 200-bar MA (hourly) and above the 100-bar MA (hourly).
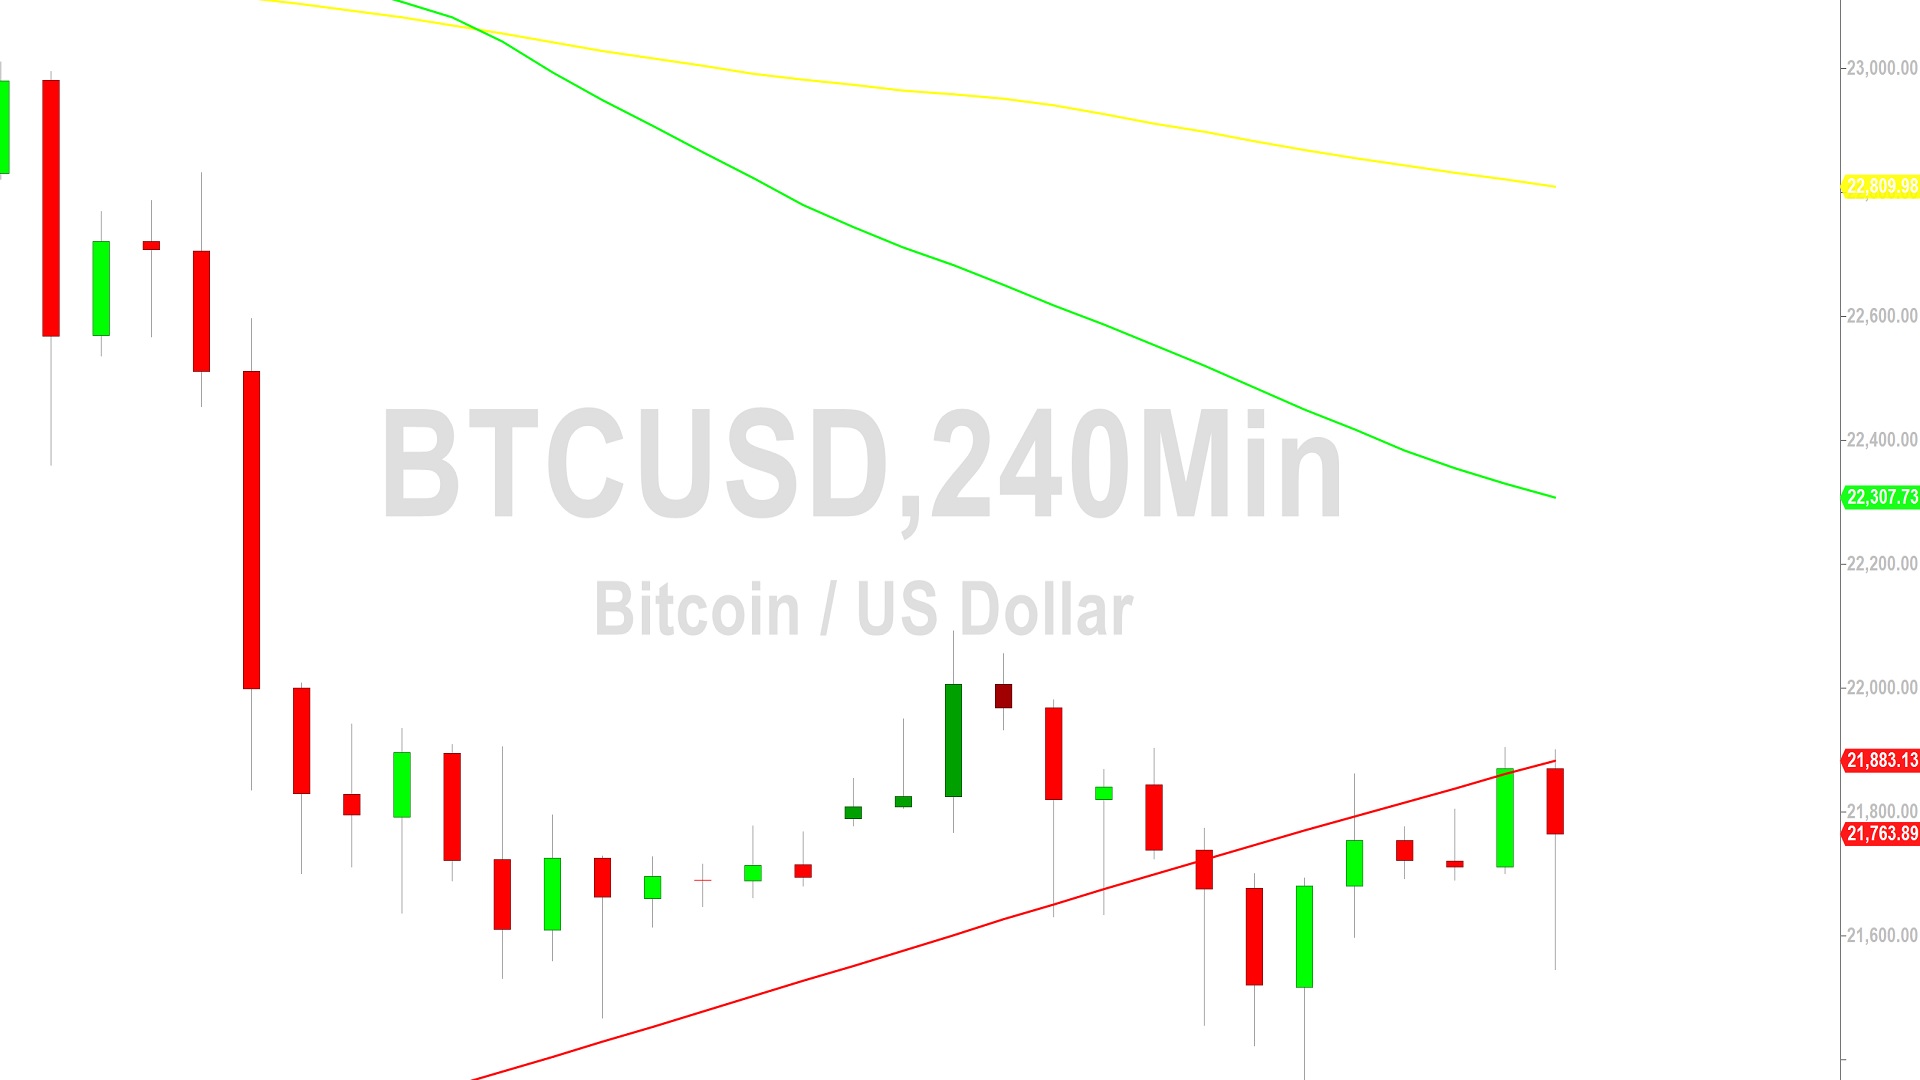
Price activity is nearest the 200-bar MA (4-hourly) at 21883.11 and the 100-bar MA (Hourly) at 21759.17.
Technical Support is expected around 18390.99/ 16714.46/ 14500.15 with Stops expected below.
Technical Resistance is expected around 25455.06/ 25774.41/ 26612.64 with Stops expected above.
On 4-Hourly chart, SlowK is Bullishly above SlowD while MACD is Bullishly above MACDAverage.
On 60-minute chart, SlowK is Bearishly below SlowD while MACD is Bullishly above MACDAverage.
Disclaimer: Sally Ho’s Technical Analysis is provided by a third party, and for informational purposes only. It does not reflect the views of Crypto Daily, nor is it intended to be used as legal, tax, investment, or financial advice.