
BTC/USD Extends Recent Surge: Sally Ho’s Technical Analysis – 13 January 2023
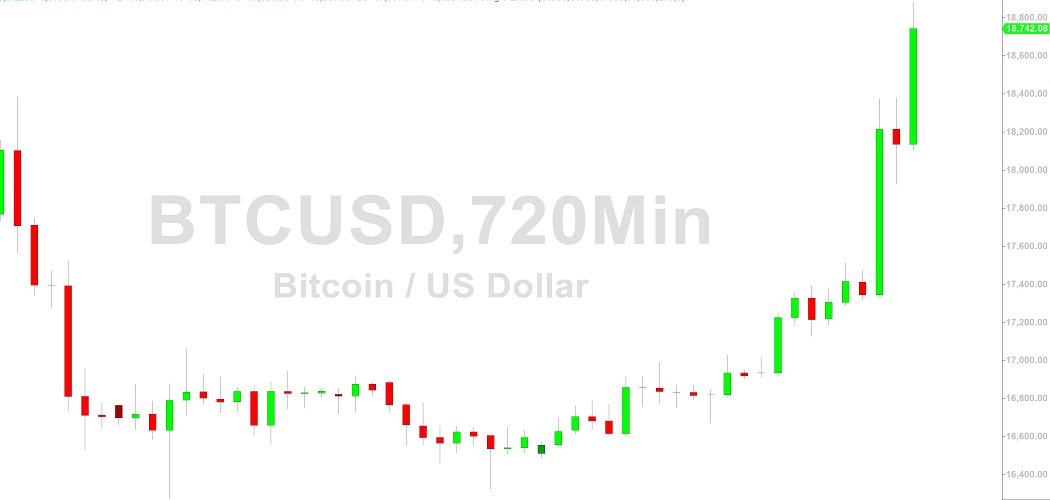
Bitcoin (BTC/USD) surged higher early in the Asian session as the pair appreciated above the 18800 level after Stops were elected above the 18385.36 level, a relative high that represented its strongest print in December. Stops were also elected above the 17933.40 area during the ascent, a level that represents the 78.6% retracement of the depreciating range from 18385.36 to 16273.40. If BTC/USD adds to recent gains, additional technically significant upside retracement levels include the 18495, 19199, 20070, and 20201 levels. Selling pressure intensified around the 17510.29 area recently and knocked BTC/USD lower to the 17315 level, a test of the 23.6% retracement of the recent appreciating range from 16670.82 to 17510.29. Additional downside retracement levels in the appreciating range include the 17189, 17090, 16991, 16868, and 16850 levels. Another technically significant range that traders are monitoring is the appreciation from 16326.16 to 17510.29, and corresponding retracement levels include the 17230, 17057, 16918, 16778, 16605, and 16579 levels
BTC/USD depreciated approximately 64% in 2022, was off more than 3% in December, and is up approximately 12.9% month-to-date. Below current price activity, BTC/USD bears are eyeing a possible test of recent two-year lows around the 15460 area, established after Stops were elected below the 15512 area. Notably, the 15512 level represented an exact bearish price objective based on selling pressure that strengthened around the 21478.80 and 18495.50 areas. Below these areas, technically significant levels include the 14613, 14500.15, 13369, 10432.73, 10727, 9682, 8837, and 7538 levels. Previous selling pressure around the 18385.36 and 17525 levels may result in possible tests of the 15900, 15313, and 14364 levels. Traders are observing that the 50-bar MA (4-hourly) is bullishly indicating above the 100-bar MA (4-hourly) and above the 200-bar MA (4-hourly). Also, the 50-bar MA (hourly) is bullishly indicating above the 100-bar MA (hourly) and above the 200-bar MA (hourly).
Price activity is nearest the 50-bar MA (4-hourly) at 17200.43 and the 50-bar MA (Hourly) at 17723.51.
Technical Support is expected around 14500.15/ 13369.11/ 10727.75 with Stops expected below.
Technical Resistance is expected around 19199.48/ 20070.64/ 20837.83 with Stops expected above.
On 4-Hourly chart, SlowK is Bullishly above SlowD while MACD is Bullishly above MACDAverage.
On 60-minute chart, SlowK is Bullishly above SlowD while MACD is Bullishly above MACDAverage.
Disclaimer: Sally Ho’s Technical Analysis is provided by a third party, and for informational purposes only. It does not reflect the views of Crypto Daily, nor is it intended to be used as legal, tax, investment, or financial advice.